
Tour insights
Visits, time per space and style, what visitors picked, tools used and how many asked for a quote.
Insights show what visitors did in a tour: how many came, how long they stayed, where they spent their time, what they chose and how many asked for a quote. Use them to see which design speaks to buyers, and to follow up at the right moment.
Open insights
On the Tours tab, select Insights on the tour card. Choose the period at the top right: last 7 days, 30 days, 90 days or 12 months.
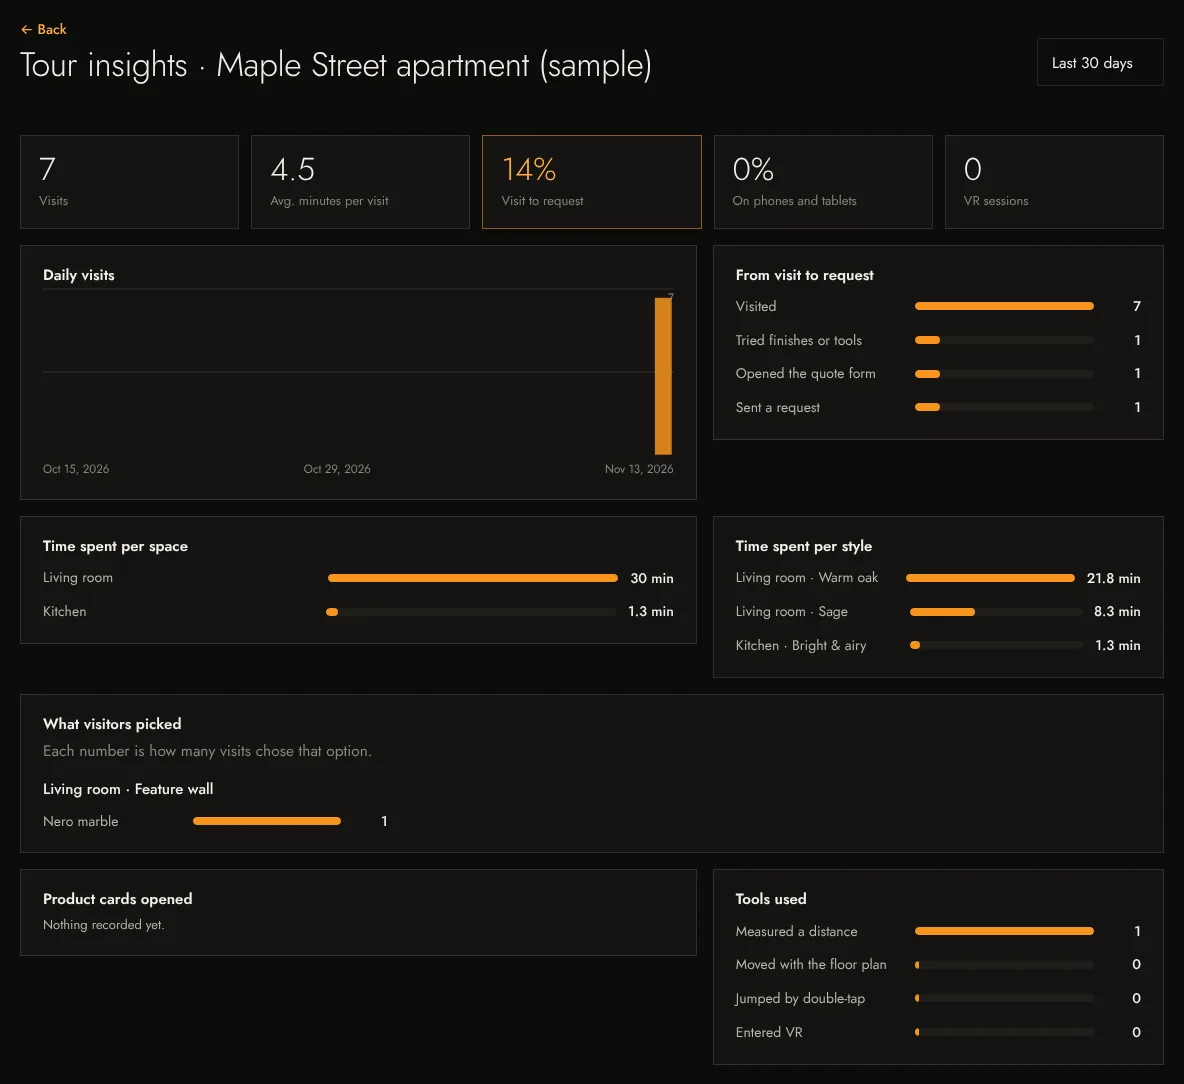
What the numbers mean
| Visits | Separate visits to the tour. One person opening it twice counts twice. |
|---|---|
| Avg. minutes per visit | How long a visit lasts on average while the tour is open and in use. |
| Visit to request | The share of visits that sent a quote request. |
| On phones and tablets | The share of visits from touch devices. |
| VR sessions | How many times someone entered VR. |
| From visit to request | The path: visited → tried finishes or tools → opened the quote form → sent a request. A big drop at one step shows where to help. |
| Time spent per space / per style | Where visitors lingered: often the space or look they care about most. |
| What visitors picked | For each client choice, how many visits chose each option. |
| Product cards opened | How often each info point was opened. |
| Tools used | Measuring, moving with the floor plan, jumping by double-tap, entering VR. |
Privacy
Insights count what happens in the tour, not who did it. Visitors are not identified unless they send a request, comment or approval themselves. See our Privacy Policy.
Your Overview tab adds up all tours for the last 30 days. See Find your way around the studio.